I kept running into the same small-but-annoying issue in my homelab:
“Wait, which host ports are already taken?”
Every time I wanted to spin up something new, I had to pause and double-check mappings. It’s not difficult — just repetitive. So I made a small widget to remove that friction.
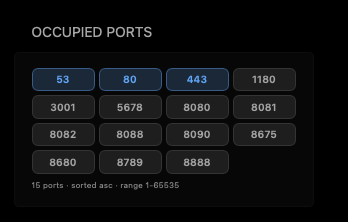
I built an Occupied Ports widget for my Glance dashboard so I can see port usage instantly while planning deployments.
Why I made this
I wanted something that feels natural during day-to-day self-hosting work:
- quick visibility
- low overhead
- no context switching to run extra commands for basic checks
For me, this is one of those tiny improvements that saves time repeatedly.
Want the bigger dashboard context? Check out my Glance post: Why Glance Became My Daily Self-Hosting Dashboard
What the widget gives me
- dynamic list of occupied/published ports
- clean visual chips in dashboard
- better confidence before choosing a new port
- fewer accidental port conflicts
Setup (quick version)
At a high level, setup is simple:
- deploy the helper service
- connect it to Glance
- add the widget block in
glance.yml
I’m keeping this post short and practical, so instead of duplicating full instructions here:
👉 Use the repo README for complete setup details, configuration, and hardening notes:
Personal takeaway
This is a small feature, but it genuinely improved my flow. I like these kinds of changes — not flashy, just consistently useful.
If you run a self-hosted stack and Glance is part of your workflow, this might help you too.